Skip to content

86 inputs per company · never published

    Configurable Quantitative Investment Intelligence

    Your investment
    philosophy,
    made systematic.

    949 listed large caps, ten sectors, one tile per name. ALB turns broad, customisable universes into quantitative market maps and portfolio workflows — without imposing a view.

    ~1,000Companies · standard universe
    86Quantitative inputs
    9Analytical families

    Style weights

    A dedicated connection, not a generic one

    Fuel your own systems.
    A customised MCP connection.

    Every output on this page — the map, the list, a security's profile, the portfolio — reaches your own AI assistant or IT and agentic systems the same way: not a shared, generic key, but a connection configured to your team, your universe and your entitlements.

    mcp_profilemcp_release_infomcp_screen_universe mcp_security_detailmcp_sector_breakdownmcp_model_portfolio mcp_build_tilted_portfoliomcp_export_csv mcp_saved_portfolios_listmcp_reports_list mcp_save_portfolio · write
    PM Team
    ChatGPT · Claude
    IT / agentic systems

    Eleven MCP tools, ten read and one write. The only thing it writes is a saved list of tickers — with a dry run, idempotent, on a separate scope that is unticked by default. No trade execution, no money movement, no bank or brokerage connectivity anywhere.

    Request an institutional walkthrough

    Professional investors only · release 2026.06

    decile
    01 / 10
    Scroll to enter ↓

    The chain, described

    The ALB Equity universe holds a standard universe of listed large-cap companies across the United States, Canada and developed Europe, grouped into ten sectors and dozens of sub-industries. Every company is measured on 86 quantitative inputs, which are never published. Those 86 inputs roll up into nine analytical families; the nine families combine into the four styles Growth, Valuation, Quality and Momentum; and the manager sets the weight of those four styles. Changing the weights recomposes every company's score and re-ranks the whole universe, which is then re-percentilised into ten equal-population deciles where 9 is best. Sector attractiveness, or breadth, is the share of names in the best deciles less the share in the worst, and it recomputes accordingly. Every security is inspectable: a decile, four continuous style scores and nine integer family scores, all on one 0–10 scale where 10 is best. The official long portfolio holds 100 positions chosen by the engine at its own published weights, a best-in-industry selection from the eligible candidates: it does not follow the user's weights, because this product contains no portfolio-construction optimiser. Any position can, however, be swapped by hand for another candidate in the same industry — the second or the third in rank — within the seats available. A separate engine produces a short book of 52 equal-weighted positions, scored on six conviction dimensions on its own scale, where a high score means a weaker company. The same outputs are reachable from an AI assistant through eleven MCP tools, ten read and one write.

    Origin

    Built from over twenty years of investment practice. Designed to keep evolving.

    ALB originates from more than twenty years of investment management, security analysis, quantitative research and continuous model refinement. That accumulated professional logic has been transformed into a configurable intelligence system for investment teams.

    Investment practice behind the model
    20+ years
    Quantitative inputs per company
    86
    Analytical families
    9
    Release cadence
    Monthly
    Coverage
    US · Canada · Developed Europe

    ALB | Equity

    One universe. One analytical language. Your strategy.

    ALB Equity turns a broad, customisable listed-equity universe into a ranked quantitative market map using 86 inputs organised into 9 analytical families.

    Universe

    Standard or custom. The standard product covers approximately 1,000 listed large-cap companies across the United States, Canada and developed Europe, subject to model eligibility and data coverage. Custom universes are assessed for mapping, data availability and feasibility before they are agreed.
    Market map

    A consistent cross-sectional ranking makes companies comparable across a defined monthly universe.

    Industry & sector intelligence

    Company intelligence becomes breadth, composition and relative insight at industry and sector level.

    Professional output

    Research, strategy configuration and portfolio workflows can be carried into committee-ready reports and editable exports as available.

    Bottom-up intelligence

    From individual companies to a market map.

    ALB begins with each company, then makes the underlying structure of industries and sectors visible. Breadth shows whether relative attractiveness is supported across a group or concentrated in only a small number of names.

    This is a bottom-up reading of the universe — not a top-down sector call imposed by ALB.

    Measure on

    Energy

    Global rank (overall)
    Best band
    66%
    Worst band
    15%
    Breadth
    +0.51

    61 names, of which 40 sit in the model’s best band and 9 in its worst. The portfolio holds 9 positions here.

    Industries within Energy

    • Oil, Gas & Consumable Fuels54+0.54
    • Energy Equipment & Services7+0.29

    The strongest names in Energy right now score 10 on a 0–10 scale where 10 is best. Breadth asks how many names are up there, not how high the best one reaches.

    1. 01Company
    2. 02Industry
    3. 03Sector
    4. 04Breadth
    ALB | EQUITY · SECTOR BREADTH
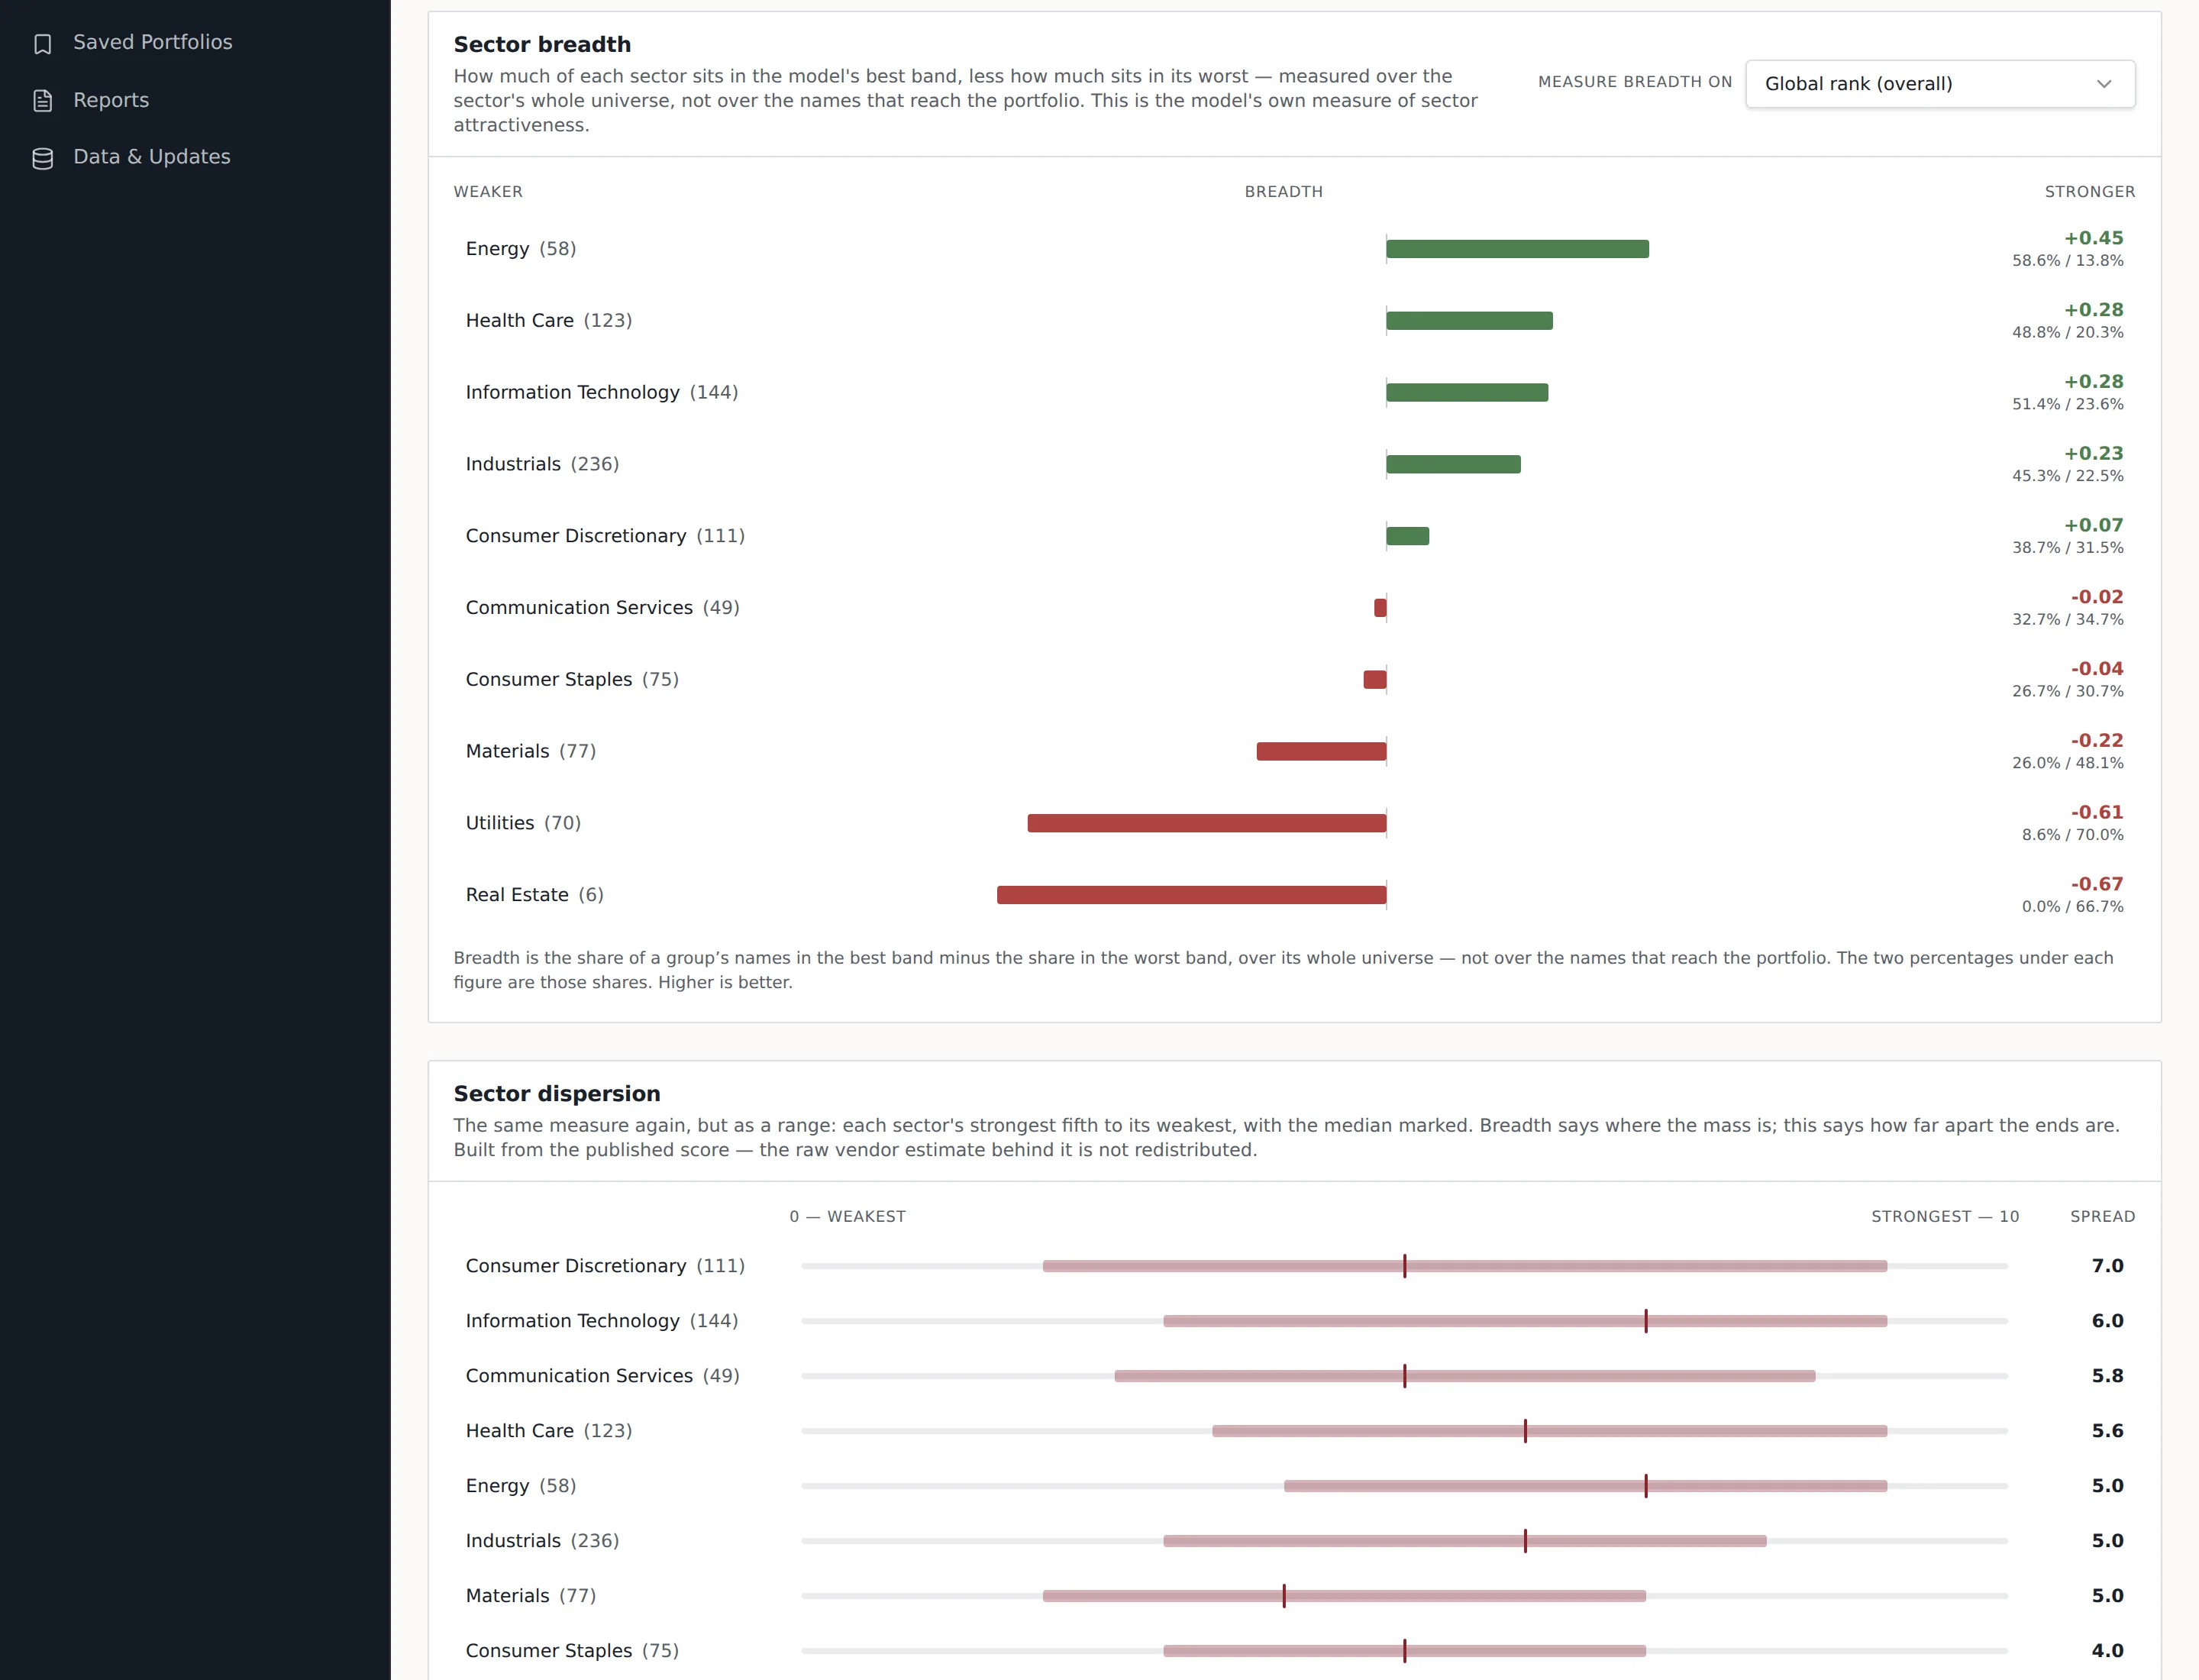
    Sector breadth in ALB Equity: each sector's share of names in the model's best band, less its share in the worst band.
    Real ALB Equity interface · current monthly release

    How it works

    Six steps, and only the last one is a portfolio.

    Every figure below is from the current release. Follow the chain and you can see where a house view could have entered — and that there is no such step.

    1. 01

      It starts with 86 measurements

      Every company in the universe is measured on 86 quantitative inputs — fundamentals, valuation, quality and market behaviour. These are the model's raw material, and they are the one thing ALB never publishes.

      ALB | Equity · current release978 names

      86 inputs per company · not published

      Shown as a count, never as a list. The sub-factor definitions are the model.

    2. 02

      Grouped into nine families

      The 86 inputs roll up into nine analytical families. This is the first level anyone outside the model sees, and every score in the product can be traced back to it.

      ALB | Equity · current release978 names

      9 analytical families

      • GROWTH SCORE
      • FCF YIELD SCORE
      • ERR & IMPL. G SCORE
      • TRADIT VALUAT METRICS
      • MARGINS & PROFITABILITY
      • LEVERAGE & MGMT BEHAVIOUR
      • MARKET INDICATORS SCORE
      • QUALITY SCORE
      • IR & RELATIVE PERF. SCORE
    3. 03

      Expressed as four styles

      The nine families combine into the four styles an investor actually reasons in — Growth, Valuation, Quality and Momentum. These are continuous, and they carry the fine ordering.

      ALB | Equity · current release978 names

      Four styles · the release’s own weighting

      • Growth23%
      • Valuation30%
      • Quality23%
      • Momentum25%

      A starting point, not a recommendation. In the product these are yours to change.

    4. 04

      Resolved into one rank

      The styles combine into a single cross-sectional rank, reported as a decile: ten bands, roughly 95 companies to a band. It places a company rather than pretending to separate it from its neighbour.

      ALB | Equity · current release978 names

      One decile · 10 bands, 9 = best

      0
      9
      WorstBest

      The overall score is a decile — one of ten bands, roughly 95 securities to a band, so it places a security rather than ranking it against every other name. The four style scores use a continuous 0–10 scale and carry the finer ordering.

    5. 05

      The sector emerges

      Sector and industry attractiveness — breadth — is not a separate judgement. It is the mechanical consequence of company-level scores: the share of names scoring well in a group, less the share scoring poorly. Those scores depend on the style weights in force, so breadth recomputes whenever a manager changes them. ALB never assigns a sector weight directly — it only ever follows from how the universe scores under the strategy chosen.

      ALB | Equity · current release978 names

      Sector breadth · best band less worst

      • Energy+0.51
      • Information Technology+0.41
      • Health Care+0.26
      • Industrials+0.17
      • Consumer Discretionary+0.13
      • Communication Services+0.04
      • Consumer Staples-0.09
      • Materials-0.33
      • Real Estate-0.50
      • Utilities-0.66
    6. 06

      And only then, a portfolio

      A manager sets two things: the style weights above, and how many positions the portfolio should hold. The industry weights that came out of step five, applied to that count, set how many positions each industry gets — and within each industry, the engine fills them with the highest-scoring names. The portfolio is the last step of the chain, not the first, which is why the product opens on the universe rather than on a recommendation.

      ALB | Equity · current release978 names

      102 positions · best names within each industry

      • Industrials27
      • Information Technology21
      • Health Care17
      • Consumer Discretionary12
      • Energy9
      • Consumer Staples5
      • Communication Services4
      • Materials4
      • Utilities2
      • Real Estate0

      Industrials leads on positions while sitting fourth on breadth. Both come from the same scores, but position count follows how many names clear the eligibility bar — not the breadth figure directly.

    Quantitative breadth. Qualitative depth.

    ALB gives small and senior teams the quantitative breadth that is difficult to maintain internally. It does not replace the analyst, and it does not impose a strategy.

    The professional defines the strategy

    Style mix, risk preferences and constraints are yours. ALB structures the analysis, comparison and workflow around them.

    Every score is inspectable

    Raw values, relative measures, analytical-family scores and Global Rank can be examined and challenged.

    Judgment stays with the investor

    ALB is a structured quantitative second opinion. Final accountability remains with the professional.

    Strategy Studio

    You set the weights. ALB does the arithmetic.

    Define Value, Growth, Quality and Momentum emphasis, together with risk parameters and constraints. The universe recomputes against your definition — not a house view.

    No house view. No black-box recommendation. Your weights, constraints and judgment remain visible.

    See the Strategy Studio
    ALB | EQUITY · STRATEGY STUDIO
    The ALB Equity Strategy Studio: style emphasis weights for Growth, Valuation, Quality and Momentum, with risk parameters and constraints.
    Real ALB Equity interface · current monthly release

    Professional outputs

    From monthly model release to committee-ready research.

    ALB carries one analytical language across the professional workflow — from a governed monthly release, to sector and company analysis, to comparison and investment-committee discussion.

    Monthly Model Release

    A versioned snapshot of coverage, validation checks and the most meaningful changes from the prior release.

    Sector Analysis

    Industry-level score patterns, constituent context and the most and least attractive names in one research surface.

    Equity Deep Dive

    A compact, explainable view of a company, its 9 analytical families and its relative position in the universe.

    Representative output formats. Reports are composed in the application and exported as print-ready documents today; spreadsheet export is still in testing. Exact availability depends on current product capability and the selected plan.

    ALB analyses investment universes. It does not collect your clients.

    • Not a CRM, client portal or end-investor data platform.
    • No end-client identities, KYC files or suitability profiles.
    • No personal financial data belonging to your clients.
    Read the product boundaries

    Plans

    A simple commercial architecture.

    The complete standard ALB Equity product, a second engine for short-side intelligence on its own track, and institutional deployments built around your requirements.

    ALB Equity

    €15,000per year

    The complete standard ALB Equity experience, based on the standard listed-equity universe and the governed Monthly Model Release.

    • Standard universe of approximately 1,000 listed companies
    • United States, Canada and Europe
    • Companies generally above approximately USD 8 billion in market capitalisation
    • Access to ALB Equity
    Explore ALB Equity

    ALB Short Intelligence

    Coming soon
    €20,000per year, at commercial launch

    A separate future analytical engine for short-side equity intelligence, to be commercialised only once production-ready.

    • Full scope and feature set to be confirmed at commercial launch
    Register interest

    ALB Institutional

    Custom pricing

    Dedicated universes, proprietary configurations, bespoke workflows, reporting, integrations and institutional service.

    • Dedicated or fully customisable listed-equity universes, assessed for feasibility before they are agreed
    • The possibility of updating the agreed universe over time
    • Multiple teams or user groups
    • White-label requirements
    Contact us

    The pilot fee is charged separately from the annual subscription. There are no other fees on these plans.

    Compare all plans

    Founding partner pilot

    A paid pilot, with half refundable and no obligation to convert.

    The ALB Equity Institutional Pilot is a real 60-day onboarding and evaluation programme. At the end, the client may request a refund of up to 50% of the pilot fee without providing a reason. The remaining portion covers onboarding, configuration and initial project work.

    If the client proceeds with an annual subscription, the full pilot fee is credited against the first annual subscription fee.

    Explore the pilot

    How the pilot fee is treated

    €5,000 · 60 days

    • At the end of the pilot you may request a refund of up to 50% of the fee, without providing a reason.
    • The remaining 50% is non-refundable. It covers onboarding, configuration and initial project work.
    • The refund is a commercial condition of the pilot. It is not a performance guarantee, and it is not tied to how the model performs.
    • There is no obligation to convert to an annual subscription.

    Coming soon

    What is not here yet, and why.

    One place for everything still in development, rather than a switch here and a greyed row there. No launch dates — a date we could not keep would be worse than no date.

    ALB Fixed Income

    Coming Soon

    We are currently defining ALB’s fixed-income intelligence offering with professional investors. Speak with us about the issuer coverage, analytical workflows and portfolio applications that would be most valuable to your team.

    Fixed income is not an extension of the equity model. It needs its own data architecture, analytical taxonomy and portfolio workflow.

    Help shape ALB Fixed Income

    How ALB talks about unreleased work

    • No launch dates, and no roadmap presented as a commitment.
    • Nothing unreleased is included in ALB Equity pricing.
    • A shared interface does not mean a shared methodology — each engine is its own.
    • Further modules are in development and are shown to signed-in users only.

    Alpha Dive

    Two engines, measured separately.

    Not a simulation. These are the months the engines ran, taken from the performance workbooks — including the months the source could not produce.

    Short Sleeve

    Benchmark · S&P 500 Equal Weight / SPW Index

    Measured as benchmark return less the shorted basket’s return, so a favourable month reads positive.

    Compounded

    +4.8%

    Since Aug 2023

    Average monthly

    +0.15%

    Mean of 36 observed months

    Favourable months

    58.3%

    21 of 36

    Observed

    36

    To Jul 2026

    Aug 2023Jul 2026

    Every month from Aug 2023 to Jul 2026 is present in the source.

    Open the Short engine

    Long Sleeve

    9 sectors · two sleeves · 36 months

    Alpha is measured per sector against that sector’s own benchmark, in a USD and a non-USD sleeve.

    Official aggregate alpha

    Methodology pending. No single portfolio benchmark or sector weighting has been approved for the Long book, so no aggregate figure exists. We are not going to derive one.

    Aug 2023USD sleeveJul 2026
    USD sleeve
    319/324 readings
    EUR & non-USD
    258/324 readings

    71 of 648 sector readings are missing in the source, unevenly across the two sleeves. They are shown as gaps, never as zero.

    Open the Long engine

    The two engines are never summed, blended or shown as one line. They carry different benchmarks, different methodologies and different observation windows, and no combined figure has been approved — so none is shown.

    How we prove it.

    No generic backtests and no universal strategy track record. The evidence is the process, its scope and its explainability.

    Process

    Documented inputs and a governed monthly release process.

    Scope

    A stated universe, stated coverage and explicit model boundaries.

    Explainability

    Rankings and component scores can be inspected, compared and challenged.

    Workflow

    A repeatable research and committee workflow, produced consistently month after month.

    See how ALB maps your investment universe.

    Professional investors only

    The current release covers 978 securities as of 31 August 2026.